Statistical Shape Modeling

Illinois Institute of Technology

Above figure gives a basic idea of what a Statistical Model of a group of shapes is. Suppose there is a set of bumps, where the only difference across the whole group is the horizontal position of the bump on the top side. Imagine if there exists a statistical model like in the right subfigure, where Mode 1 fully captures this bump horizontal positional variation, then it'd be easy to represent any shape instance in the entire group.

     
In order to compute SSM of a given group of shapes (training set), a fixed number of points must be sampled on each shape to construct the covariance matrix and then generate a statistical model under its current sampling configuration. Above shows a particular way of sampling 50 points across the group, and the SSM is obtained as the mean shape plus the first mode that captures the horizontal movement of bump.

Evidently, different sampling configurations lead to different SSMs, and sampling itself defines how shapes CORRESPOND to one another across the training set, in other words "Shape Correspondence". Above are two ways of sampling the shapes, hence two states of group-wise shape correspondence, one is bad and the other good in an intuitive sense. There are two colored indicators, one in blue and one in green, to visualize the correspondence. On the left, bump corners are awfully matching up, while on the right, the two bump corners in green and blue are very well matching up or corresponding across all shapes.

               
Each state of corresondence will associate with a statistical model, and the quality and usability of the SSM really depends on the quality of group-wise shape correspondence. It's observed the bad correspondence generates an SSM on the left above which fails to capture any shape variation, whereas the good correspondence is unable to result in a reasonable SSM on the right capturing the desired variation pattern. All that said, the key to statistical shape modeling is the search for an optimal shape correspondence, which can be solved by optimization formulations.

Overview

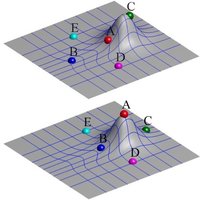
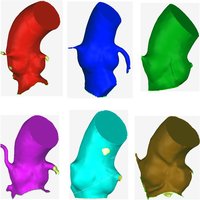
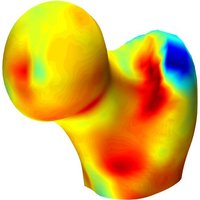
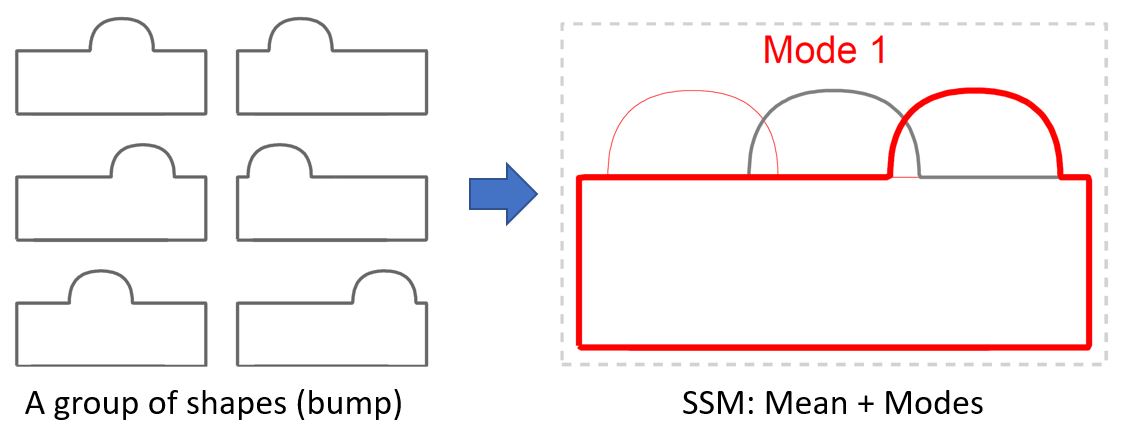
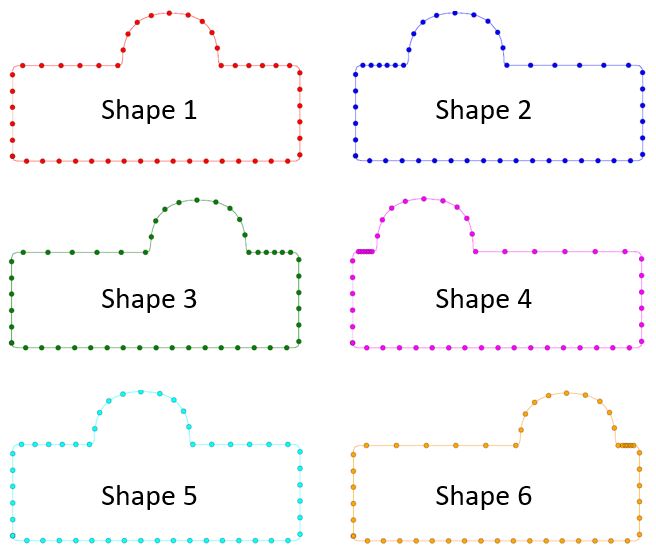
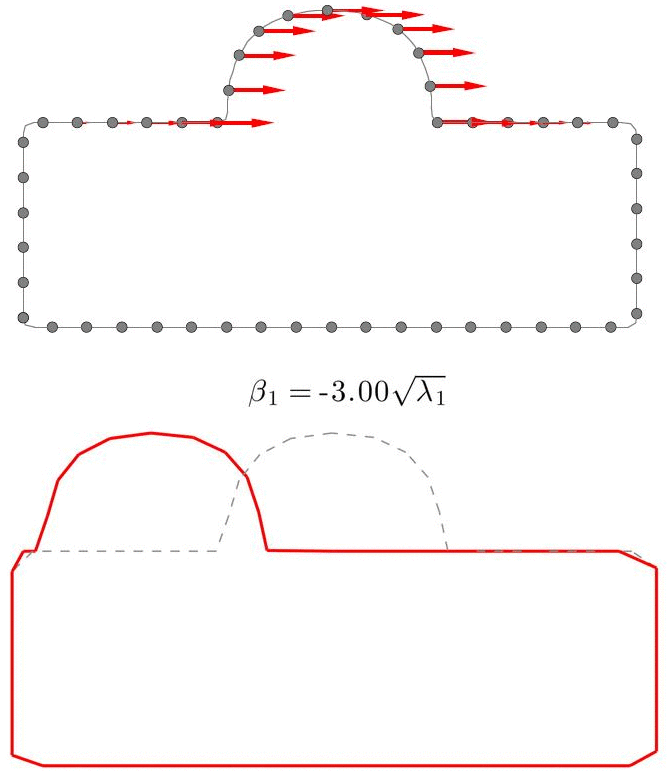
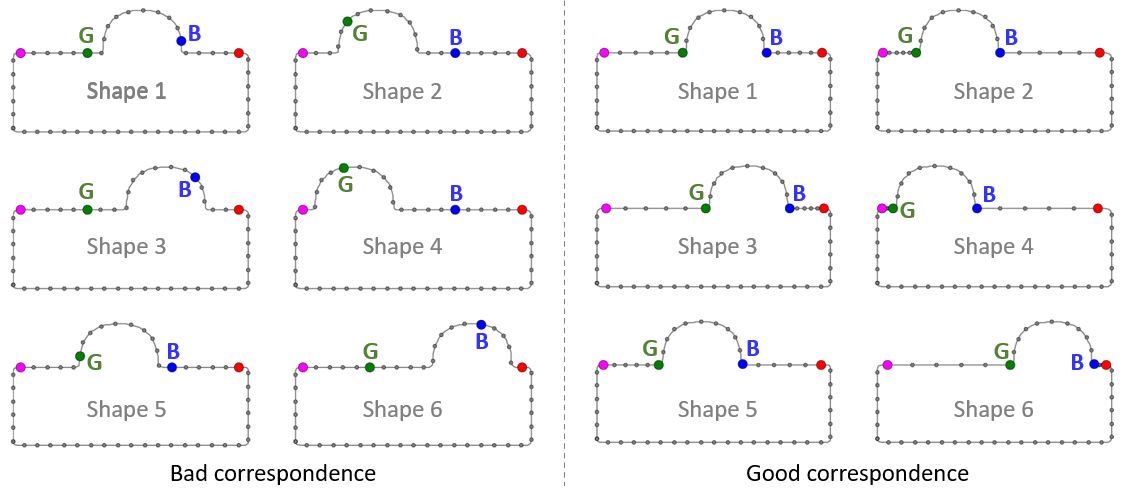
A Statistical Shape Model (SSM) serves as a compact characterization of the shape variation pattern in a group of shapes (training set). Initially it was used for the automation of image segmentations, and then it has been employed in a great variety of other applications such as pattern recognition, computer animation and medical diagnosis etc. Building SSM reduces to searching for correspondence across the entire training set shape instances. The population-based approach formulates the search as an optimization problem that minimizes a measure (e.g. Description Length) of resultant SSM, and gives correspondence and SSM of desirable quality. During optimization, the correspondence updates are achieved by reparameterizing shapes in the parameter space.

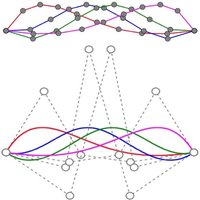
Previously, the reparameterization function is modeled by concatenating a large number of local warps, leading to extremely inefficient iterations and huge time cost. We propose a direct representation of the reparameterization function by B-splines, develop associated diffeomorphism conditions and derive fast gradient formula by adjoint method. Both synthetic examples and real medical applications have confirmed the effectiveness of proposed algorithm and the efficiency advantages. As a key mathematical entity in the statistical modeling and correspondence optimization, the covariance matrix is also studied in the context of both discrete and continuous representation of shape instances.

We are very thankful to the National Science Foundation for the following grants:

- Award #0900597  Direct Digital Design and Manufacturing (D3M) from Massive-Point-Cloud Data
- Award #1030347  Direct Measurement from Scan Data with Adaptive Moving Least-Squares Surfaces under Controlled Spatial Dependency

Publications

Dissertation